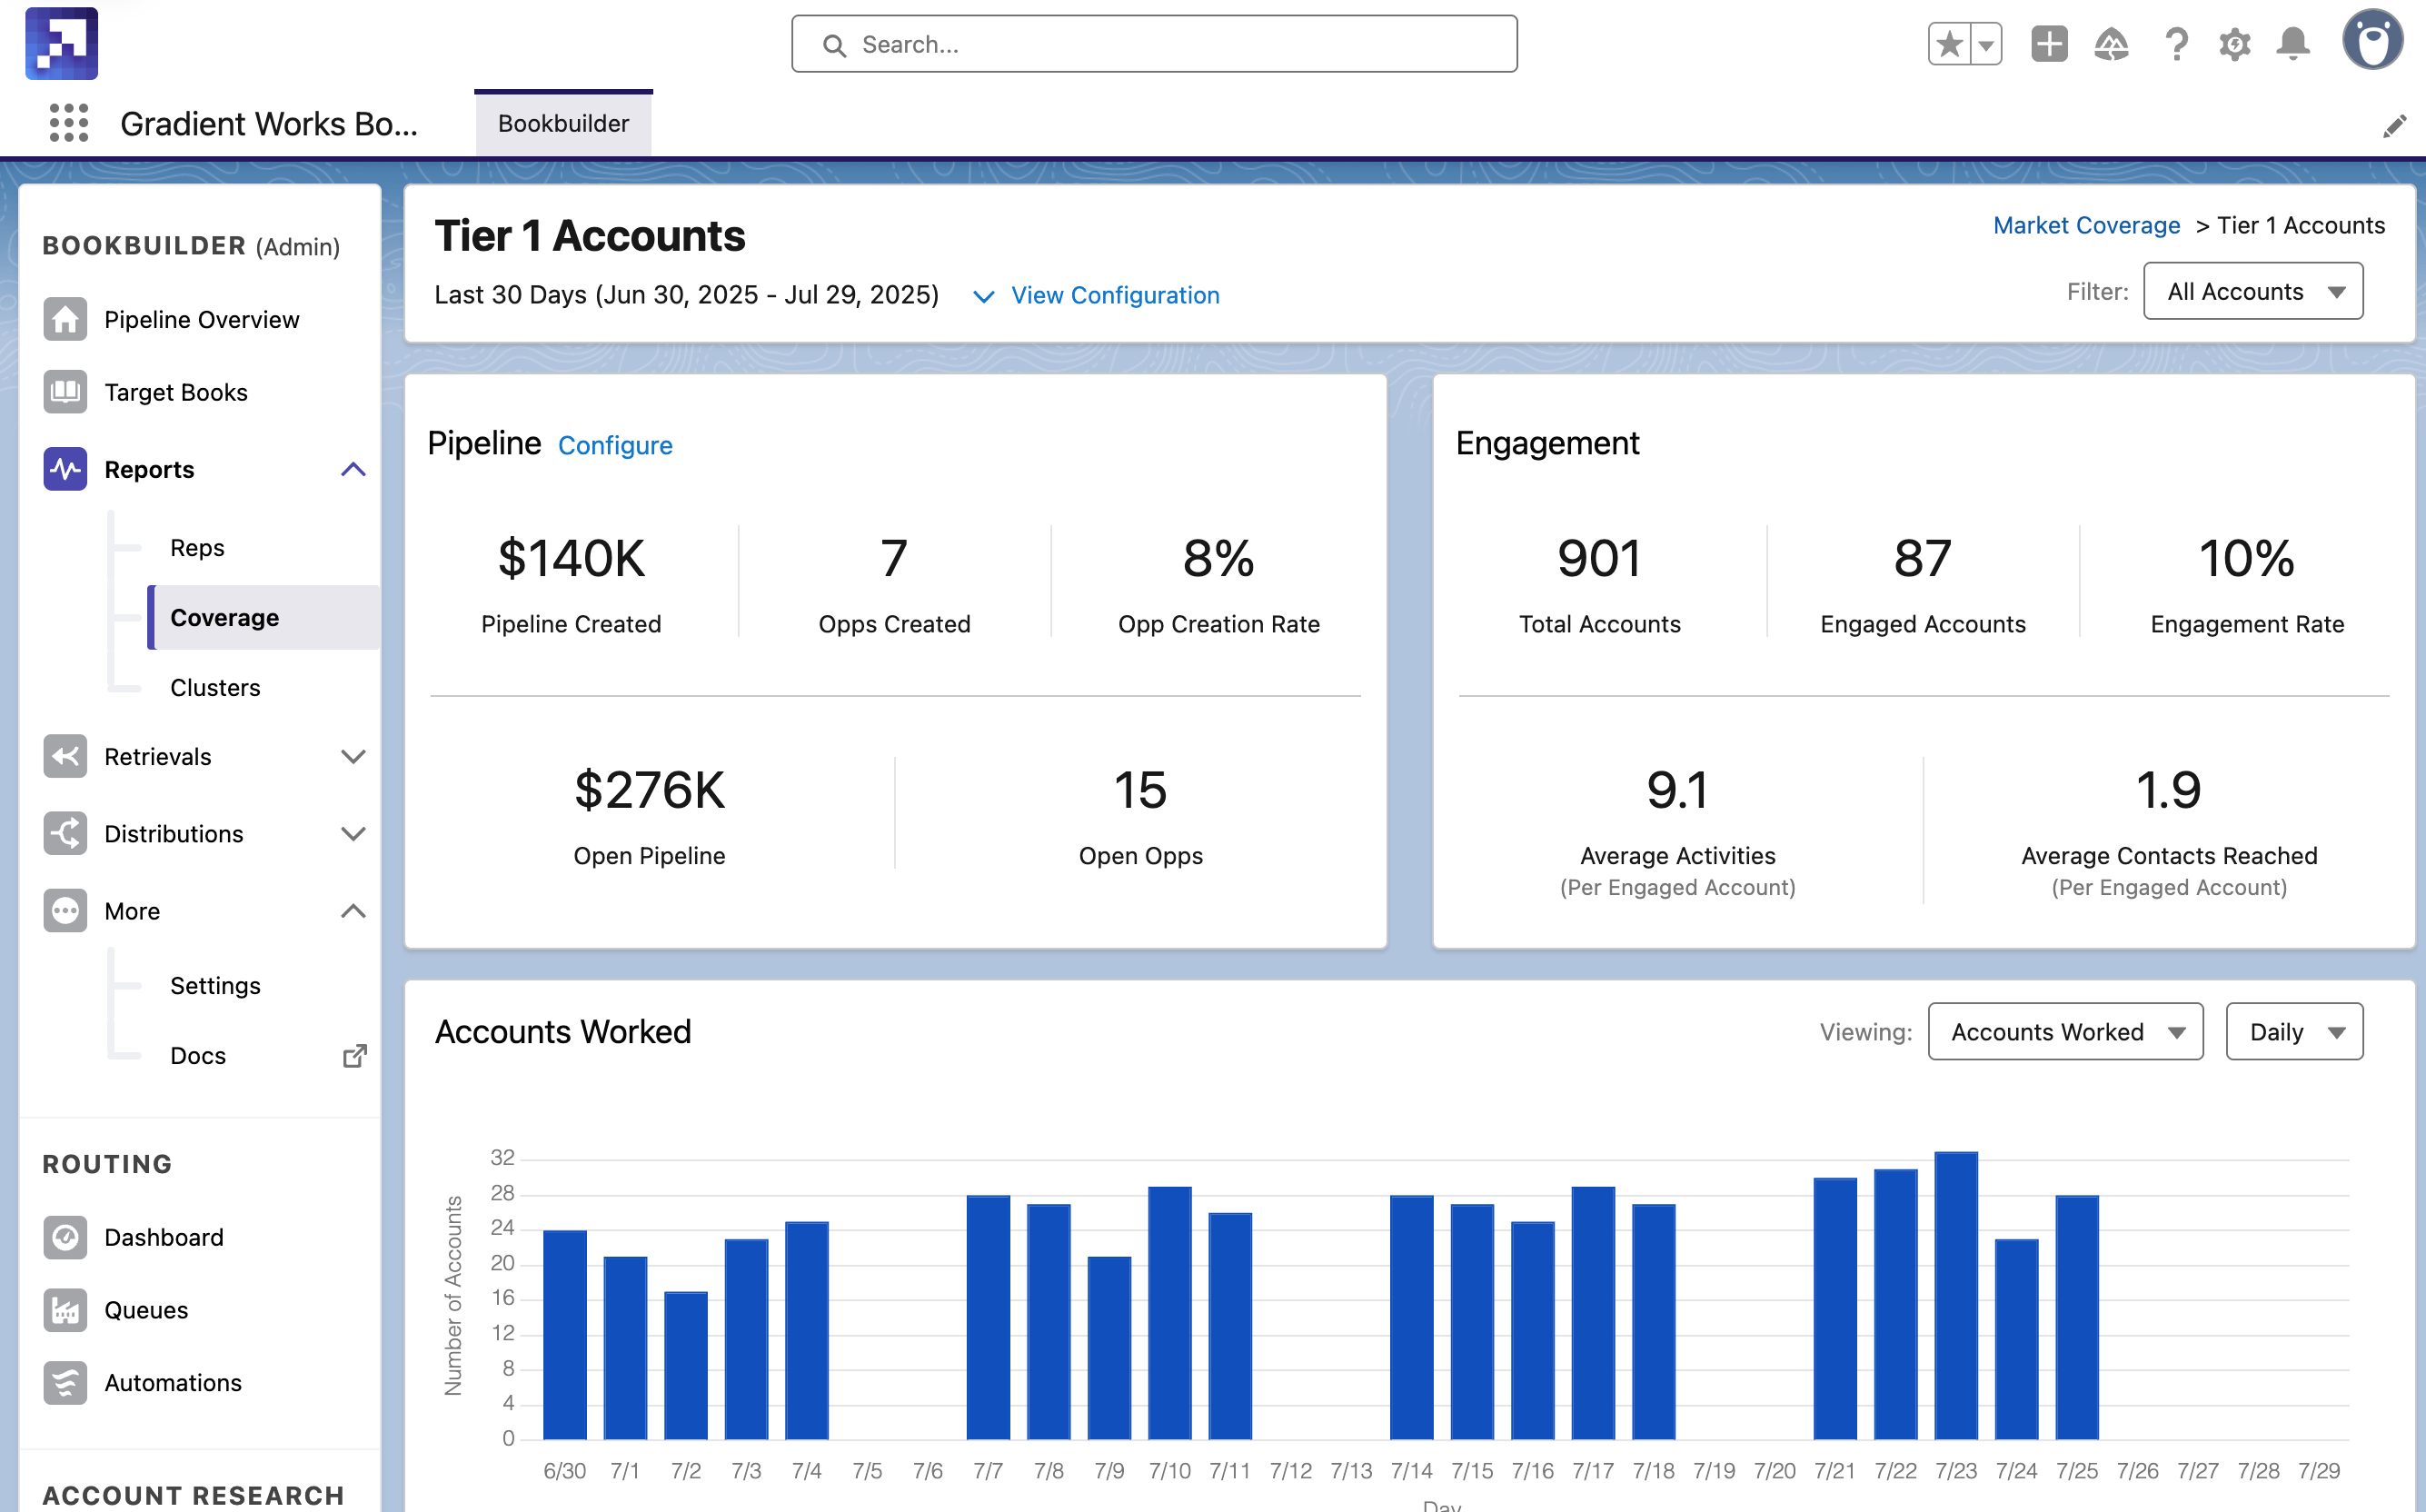
# Coverage Reports

### Accessing market coverage reports

Click "Coverage" under "Reports" in the left nav to access existing and create new coverage reports.

### Creating a report

In the Coverage report section, click the "New Report" button. From there, you can set up a new report that meets the criteria you include.&#x20;

<figure><img src="https://2378295204-files.gitbook.io/~/files/v0/b/gitbook-x-prod.appspot.com/o/spaces%2FUYXbv7c6RsZzQ00WCDTM%2Fuploads%2FJMsiOMadLjoztRh17wNy%2FScreenshot%202025-07-29%20at%2010.10.33%E2%80%AFAM.png?alt=media&#x26;token=143e2601-2f50-47bd-accd-3083cb94a1df" alt=""><figcaption></figcaption></figure>

{% hint style="success" %}
Success tip

A coverage report can cover most any account segment you can think of. Use these to create reports about important segments, like Tier 1 accounts, commercial accounts, specific verticals or other plays.&#x20;
{% endhint %}

### Interpreting the report

The coverage report has four major sections:

* Pipeline
* Engagement
* Accounts Worked
* Accounts and Reps Table

<figure><img src="https://2378295204-files.gitbook.io/~/files/v0/b/gitbook-x-prod.appspot.com/o/spaces%2FUYXbv7c6RsZzQ00WCDTM%2Fuploads%2FrxGwOVOa0eixJMkzJlHC%2FScreenshot%202025-07-29%20at%2010.11.41%E2%80%AFAM.png?alt=media&#x26;token=d4b7dd8e-89f6-4417-a7fa-91a7161f799e" alt=""><figcaption></figcaption></figure>

### Pipeline section

This section provides a summary of how much pipeline your team has created in this market segment, and how efficiently they're creating it. Here are the metrics included:&#x20;

<table><thead><tr><th width="213.5">Metric</th><th>Description</th></tr></thead><tbody><tr><td>Pipeline Created </td><td>The amount of pipeline created, in dollars, in the report period</td></tr><tr><td>Opps Created</td><td>The number of new opportunities created in the report period. You can click on this metric for details on the opps included in that number.</td></tr><tr><td>Opp Creation Rate</td><td>The ratio of opps created to accounts worked (X opps / Y accounts) for the report period</td></tr><tr><td>Open Pipeline</td><td>The total amount of open pipeline currently in this segment (the opp creation date could be before this report period, as long as the opp is still open during the report period). </td></tr><tr><td>Open Opps</td><td>The total number of open opps in this segment. You can click this number for details on the opps. </td></tr></tbody></table>

If you're seeing 0s in any of these metrics, you may need to update your configuration. Click the "Configure" link and make sure you've configured all 3 settings:&#x20;

* Included Opportunities: Any criteria an opp has to meet to be included in opp creation metrics
* Opp Value Field: The field we should use for calculating the monetary value of an opp
* Opp Creator Field: The field we should use for determining who created an opp

### Engagement section

This section provides a summary of your team's account coverage activities across this market segment. How are they engaging these accounts?

<table><thead><tr><th width="213.5">Metric</th><th>Description</th></tr></thead><tbody><tr><td>Total Owned </td><td>The number of accounts the rep owns based on their associated <a href="../bookbuilder/target-books">target book's</a> ownership field.</td></tr><tr><td>Engaged Accounts</td><td>The number of accounts the rep has engaged over the report period.</td></tr><tr><td>Engagement Rate</td><td>The percentage of owned accounts where the rep has logged <strong>at least one</strong> working activity during the time range of the report.</td></tr><tr><td>Average Completed</td><td>The average number of activities the rep has logged per engaged account.</td></tr><tr><td>Average Contacts Reached</td><td>The average number of contacts the rep has logged an activity for on engaged accounts. </td></tr></tbody></table>

### Activities section

This section includes a chart showing accounts worked, activities and opp creation over time. You can hover over any column for more details.

### Accounts and Reps table

This section provides a view of rep engagement across the accounts in this segment. There are two views: one for Accounts and one for Reps. You can click on any account name or rep name for further detail.&#x20;

You can sort the columns by clicking on the column heading. You can also export this data to an Excel file for further analysis.&#x20;

<figure><img src="https://2378295204-files.gitbook.io/~/files/v0/b/gitbook-x-prod.appspot.com/o/spaces%2FUYXbv7c6RsZzQ00WCDTM%2Fuploads%2FQ1yhUkiyS4im7AJ6LX91%2FScreenshot%202025-07-29%20at%2010.11.48%E2%80%AFAM.png?alt=media&#x26;token=801fa725-dba8-4783-93c3-eeb48fb63349" alt=""><figcaption></figcaption></figure>

#### Accounts

In the Accounts view, you can see a list of all accounts in this segment. You can filter the view to shows engaged accounts (every account that had at least one activity logged over the report's time period) or unengaged accounts (every account that went unworked in the time period).

By default, the table includes columns like "Created Pipeline", "Open Opps", "Activities" and more. You can customize these views (see below) to display data that's most relevant for your sales motion. You can include any field from the account record.&#x20;

{% hint style="success" %}
Success tip

Sort the table by a metric like "Activities" to see which accounts are receiving the most engagement (or which ones aren't getting enough attention).&#x20;
{% endhint %}

You can click on any account name in this table to view the account sidebar, which include more information about that account, as well as a short summary of recent activity with that account. From there, you can view the full account record or assign the account to a new rep.

<figure><img src="https://2378295204-files.gitbook.io/~/files/v0/b/gitbook-x-prod.appspot.com/o/spaces%2FUYXbv7c6RsZzQ00WCDTM%2Fuploads%2FrgBt6LpkFrEnykEAJqQ8%2FScreenshot%202025-07-29%20at%2011.14.01%E2%80%AFAM.png?alt=media&#x26;token=3d22bebc-343d-48b7-a366-f69bde65ab4a" alt="" width="375"><figcaption></figcaption></figure>

#### Reps

The Reps view shows you a side-by-side comparison of a sales reps working accounts in this report's segment. This allows you to quickly see who's putting in the work, who's creating pipeline, and who could use some support. You can click on any rep's name to get a detailed list of their accounts and activities on those accounts.

#### Changing columns

You can change the fields displayed in the table of the report by clicking "Customize Columns". This will open the "Customize Columns" dialog.

<figure><img src="https://2378295204-files.gitbook.io/~/files/v0/b/gitbook-x-prod.appspot.com/o/spaces%2FUYXbv7c6RsZzQ00WCDTM%2Fuploads%2FOuelmAzY7Z0RAaZ8T52s%2FScreenshot%202025-07-29%20at%209.48.25%E2%80%AFAM.png?alt=media&#x26;token=360b0788-fb23-4c04-a868-d834259912f1" alt=""><figcaption></figcaption></figure>

Select the fields you would like to include in the report from "All Account Fields" on the left, moving them to the "Fields to Display" section on the right. You may choose any field on the account object as well as any [working activities](https://docs.gradient.works/kb/analytics/working-activities) category to display.
